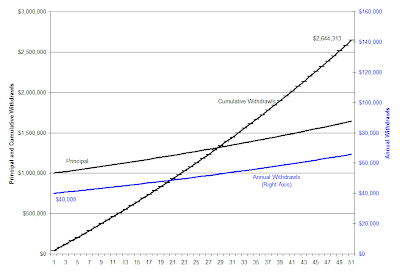
Tom is thrifty and decides to withdraw only 4% of the principal each year. He received $40,000 the first year, and the principal continues to grow. After 20 years he has withdrawn a total of $929,568, the principal has grown to $1,220,190 and is still growing.
A graph, showing Tom’s annual withdrawals (shown in blue and scaled by the right-hand axis), the cumulative withdrawals, and the remaining principal (both scaled by the left-hand axis) over 50 years is shown below.
 |
| (Click to view full size) |
Brother Sigmund was able to defer his spending somewhat, but then needed more money for a period of time. A graph, showing the annual withdrawals, the cumulative withdrawals and the principal over 50 years for Sigmund’s spending strategy is shown below.
Brother Bill spent more than was being earned each year for more than 30 years. A graph, showing the annual withdrawals, the cumulative withdrawals and the principal over 50 years for Bill’s spending strategy is shown below.
Although Bill’s early withdrawals were significantly larger than those of his other brothers, the principal has been significantly reduced and the cumulative withdrawals soon flatten out considerably below that of his thrifty brothers. Note that after 40 years Bill has finally reacted to the diminishing principal, sharply curbed his spending, and the principal is beginning to grow once again. It would take several decades to restore the principal to the original amount at this growth rate.
Brother Ben lives in the fast lane and seems to learn in the slow lane. He spent more than was being earned each year for more than 30 years. A graph, showing the annual withdrawals, the cumulative withdrawals and the principal over 50 years for Ben’s spending strategy is shown below.
He consistently spent more than the interest income, and although at first he may have enjoyed larger income than his brothers, his cumulative withdrawals are the lowest of the four, and the principal is nearly exhausted and almost impossible to restore to the original level.
The following table summarizes key figures for each of the four brothers:
| Tom | Sigmund | Bill | Ben | |
Cumulative Withdrawals after 20 years | $929,568 | $1,161,891 | $1,281,950 | $1,309,025 |
Cumulative Withdrawals after 50 years | $2,644,313 | $2,667,823 | $1,699,340 | $1,537,215 |
Annual Income in Year 50 | $65,785 | $50,198 | $8,278 | $3,194 |
Principal after 50 years | $1,644,632 | $1,003,955 | $275,931 | $63,888 |
These four brothers have illustrated each of four system behaviors of a renewable resource. Thrifty Tom ensured the outflow—his annual spending—was always less than the restorative flow—the annual interest income. This allows for continuous growth indefinitely.
Shrewd brother Sigmund was able to enjoy an interval where his annual spending exceeded the annual investment income, and because he watched signals closely and reacted quickly, he was able to adjust his spending in time to recover the full principal. The result is an S-shaped growth curve called a sigmoid.
Brother Bill went on a binge. His annual spending exceeded the annual income for an extended period of time. He was slow to react to the diminishing principal, but eventually did sharply reduce his annual spending. The principal can eventually recover, but it will take a very long time. His spending greatly overshot the income but can grow and recover, probably eventually resulting in an oscillation, repeating the overshoot pattern.
Brother Ben was on a bender. His annual spending exceeded the annual income for an extended period of time. Because he still had money to spend he was so slow to react to the diminishing principal it is essentially exhausted. The overshoot was severe enough that the investment income has collapsed to a point where it may never recover.
System dynamic theory uses the term stock to refer to amount of a resource available at any particular instant in time, and the term flow to refer to the rate of change of the stock of resource. In this simple scenario, the principal is the stock, and it is affected by two flows. The 5% annual investment income increases the stock level and the annual spending, decided by each brother, decreases the stock level.
Tom’s renewable scenario relied on one simple rule: Ensure the consumption flow rate is less than the renewal flow rate.
Sigmund’s more dynamic strategy was successful because he watched the flow rates carefully and reacted quickly to the diminishing stock.
Brother’s Bill and Ben consumed stock in excess of the renewal rate, ignored the warning information signaled by the diminishing stock, and delayed in taking action. The annual withdrawals overshot the system’s capacity for renewal.
Tom and Sigmund both have grandchildren who are grateful for the careful stewardship and enjoy substantial inheritances preserved over so many years. Bill and Ben’s grandchildren are envious.
Pay me now or pay me later, as they say.
Note: This story was written to illustrate several system analysis concepts for the Wikiversity course "Limits to Growth".


